You read it right, there is no dought this is going to be a nightmare for me but anyways I am going to do my best.
Structure the map
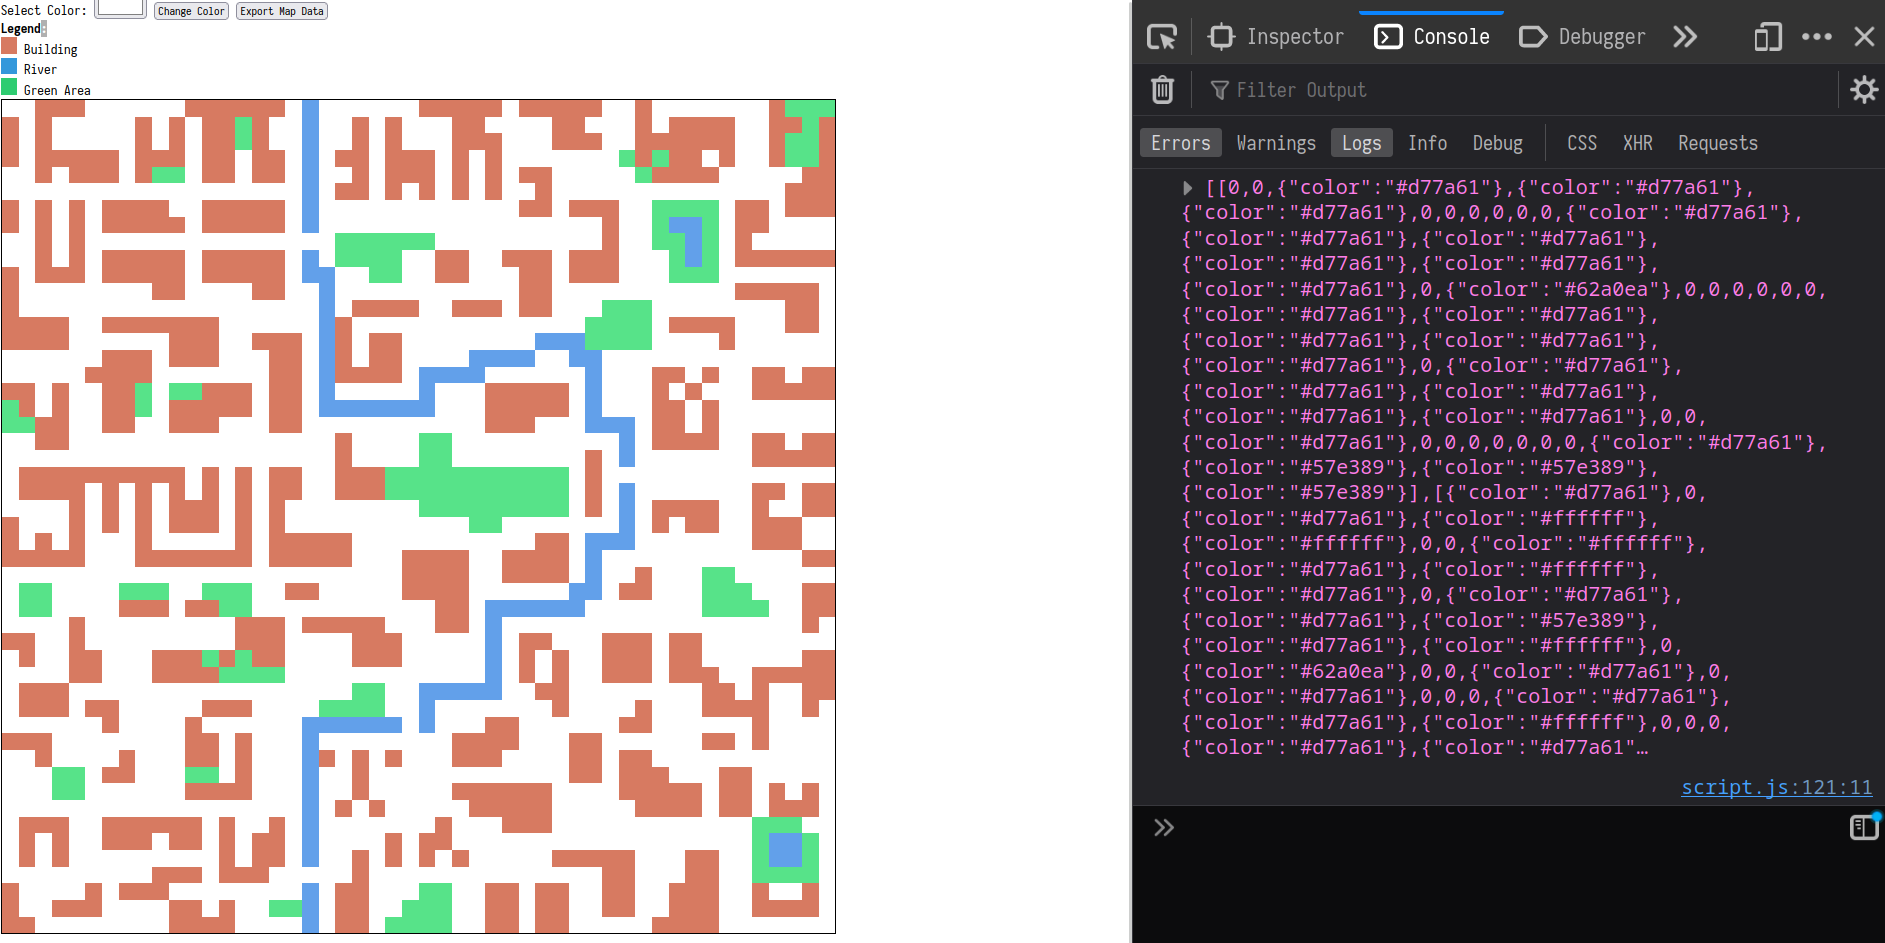
It’s important to know how to sturcture the map so that traversing it would be easy, I have choosen the simplest way to represent the map as a 2D array!
Having a well defined map structure will later on descide how are we going to build the API! and also have great impact on performance.
Zeros mean you can visit, otherwise obstacles (Simple!)
Generating the map
Let’s face it, I suck at Frontend so I don’t expect to build the prettiest map!
I will be creating the map manually using JS and HMTL.
Let’s start with the map as empty 2D array with zeros.
1
2
3
4
5
6
7
8
constsize=1000;constgridCount=100;constsquareSize=size/gridCount;// create an array of zeros with the size of the map
constgridMap=newArray(gridCount).fill(0).map(()=>Array(gridCount).fill(0));
Appending the rects to the SVG
rect represents the block in the map aka pixel
1
2
3
4
5
6
7
8
9
10
11
12
13
14
15
16
17
18
// add all the rects inside the svg
for(letx=0;x<gridCount;x++){for(lety=0;y<gridCount;y++){constrect=document.createElementNS("http://www.w3.org/2000/svg","rect");// save the rect in the points object
points[`${x},${y}`]=rect;rect.setAttribute("width",squareSize+squareSize/2);rect.setAttribute("height",squareSize+squareSize/2);rect.setAttribute("x",x*squareSize-squareSize/2);rect.setAttribute("y",y*squareSize-squareSize/2);rect.setAttribute("fill","white");rect.addEventListener("click",()=>draw(x,y));svg.appendChild(rect);}}
Draw function
To make the map attractive I have colors for pixels:
constdraw=(()=>{letcount=0;letminX=(maxX=minY=maxY=null);constallPoints=[];// a function to highlight the selected cells
consthighlight=()=>{for(letx=minX;x<=maxX;x++){for(lety=minY;y<=maxY;y++){constrect=points[`${x},${y}`];rect.setAttribute("fill",currentColor);}}};return(x,y)=>{count++;if(!minX||minX>x)minX=x;if(!maxX||maxX<x)maxX=x;if(!minY||minY>y)minY=y;if(!maxY||maxY<y)maxY=y;highlight();// mark the location
gridMap[y][x]={color:currentColor,};minX=maxX=minY=maxY=null;};})();